Top 10 futures trading strategies and how they work
Learn how ten futures trading strategies work, from trend following to spread trading, plus the indicators, margin requirements and risks behind them.
Perps
By Ekaterina Drozdovica

A market moving steadily higher calls for a different approach from one bouncing between the same two price levels. Futures trading strategies give traders a framework for interpreting those moves, deciding when to enter or exit, and managing what happens if the market goes against them.
Some approaches follow a trend for weeks. Others focus on price changes that last seconds or on the gap between two related contracts. Below, we explain ten common strategies, the tools traders use to assess them and the risks that come with each.
This article is provided solely for informational and educational purposes and does not constitute financial, investment, legal, tax, or other professional advice, nor should it be relied upon as such. Nothing contained herein should be construed as a recommendation, endorsement, solicitation, or offer to buy, sell, or hold any financial product or investment.
Clients should do their own research and consult with qualified professional advisers before making any financial or investment decisions. Past performance is not indicative of, and does not guarantee, future results.
What shapes a futures trade?
Futures provide exposure to markets such as commodities and stock indices through contracts linked to an underlying asset. Traditional futures set terms for buying or selling that asset at an agreed price on a future date, with settlement determined by the contract.
Traders use them for different reasons. Hedgers seek to reduce exposure to price changes in something they own or expect to buy. Speculators aim to profit from those changes, adding trading activity that helps other participants enter and exit positions.
Margin, leverage and contract size
To open a futures position, traders post initial margin: Money that supports the position rather than paying its full value. This creates leverage, meaning a relatively small amount of capital controls a larger market exposure.
Leverage amplifies both gains and losses. Understanding a contract’s minimum price movement, called a tick, and the dollar value of that movement helps traders translate changes on a chart into changes in their account balance.
Expiration and the futures curve
Traditional futures expire on a scheduled date. Perpetual futures have no scheduled expiration and can remain open while the trader meets the applicable margin requirements. They use periodic funding payments to help keep their price aligned with the underlying spot market.
For contracts with expiration dates, traders also watch the futures curve, which plots prices across different delivery dates. An upward-sloping curve is generally described as contango; a downward-sloping curve is associated with backwardation. Its shape can offer clues about supply and demand and affect the outcome of holding and replacing expiring contracts.
Futures trading strategies for following a market move
Trend trading, pullback trading, breakout trading and momentum trading all look for a directional move. Their main difference is the point at which a trader gets involved: During an established trend, after a pause, as a price leaves a range or when a move accelerates.
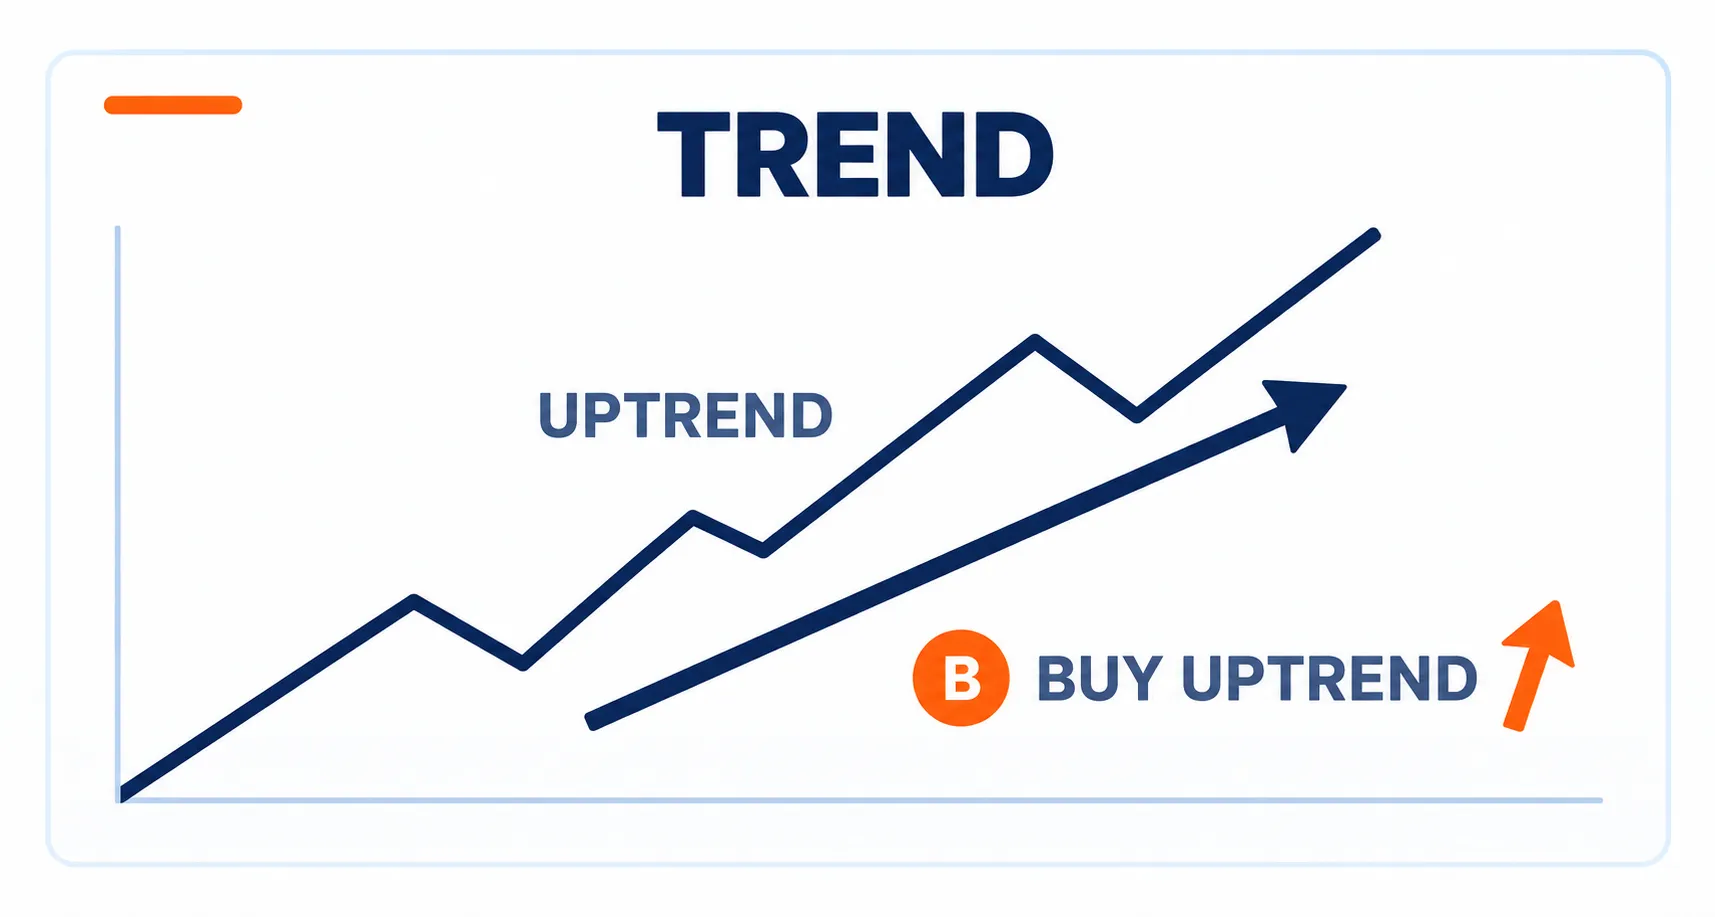
1. Following an established trend
Trend traders look for a sustained upward or downward direction and aim to stay with it while the conditions supporting the move remain in place. Economic developments can drive extended cycles in futures markets, making the broader direction a useful starting point.
Moving averages help smooth out short-term fluctuations so that direction is easier to see. For traditional futures, however, the price chart is only part of the picture. Traders holding exposure across expiration dates also need to consider the futures curve.
A long position may benefit from positive roll yield in backwardation when the trader replaces an expiring contract with a cheaper later-dated one. That effect is separate from whether the underlying market moves in the trader’s favor.
2. Entering after a pullback
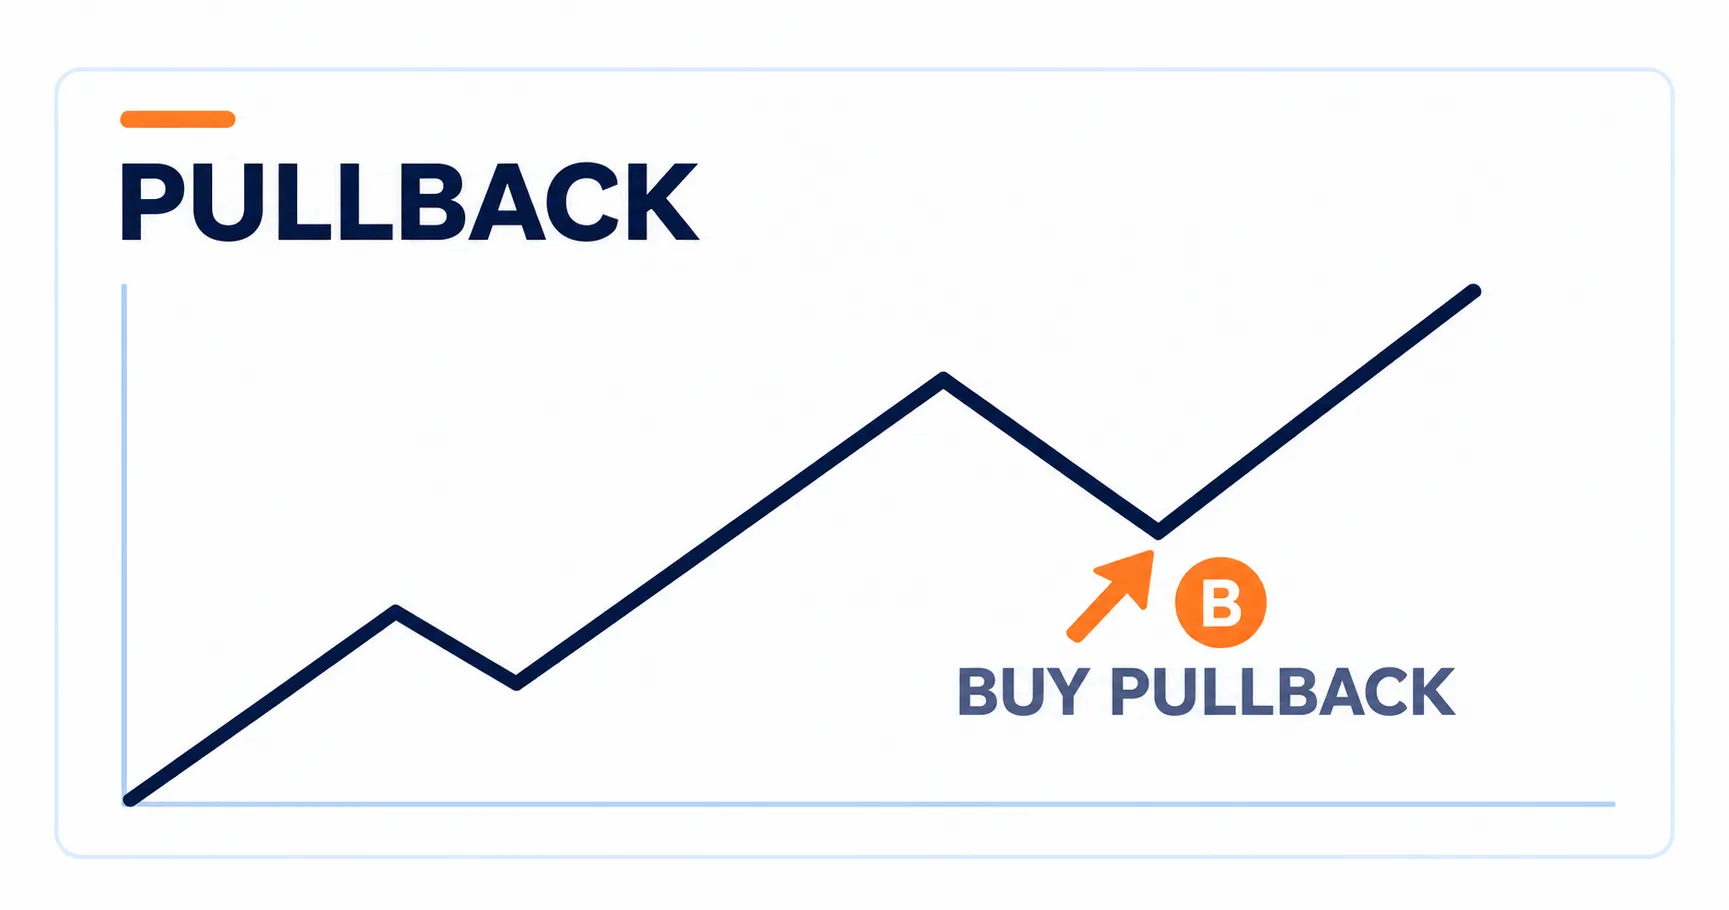
A pullback trader waits for a temporary move against an existing trend. During an uptrend, that means looking for an entry after a dip; during a downtrend, it can mean waiting for a brief rebound before opening a short position.
Moving averages and Fibonacci retracement levels can help identify areas where that pause might end. The aim is to find a more favorable entry than chasing a price that has already moved sharply.
The difficulty is distinguishing a pause from a reversal. Traders may place stop-loss orders beyond a recent swing low or high, although a stop-loss does not guarantee execution at the chosen price.
3. Trading a break out of a range
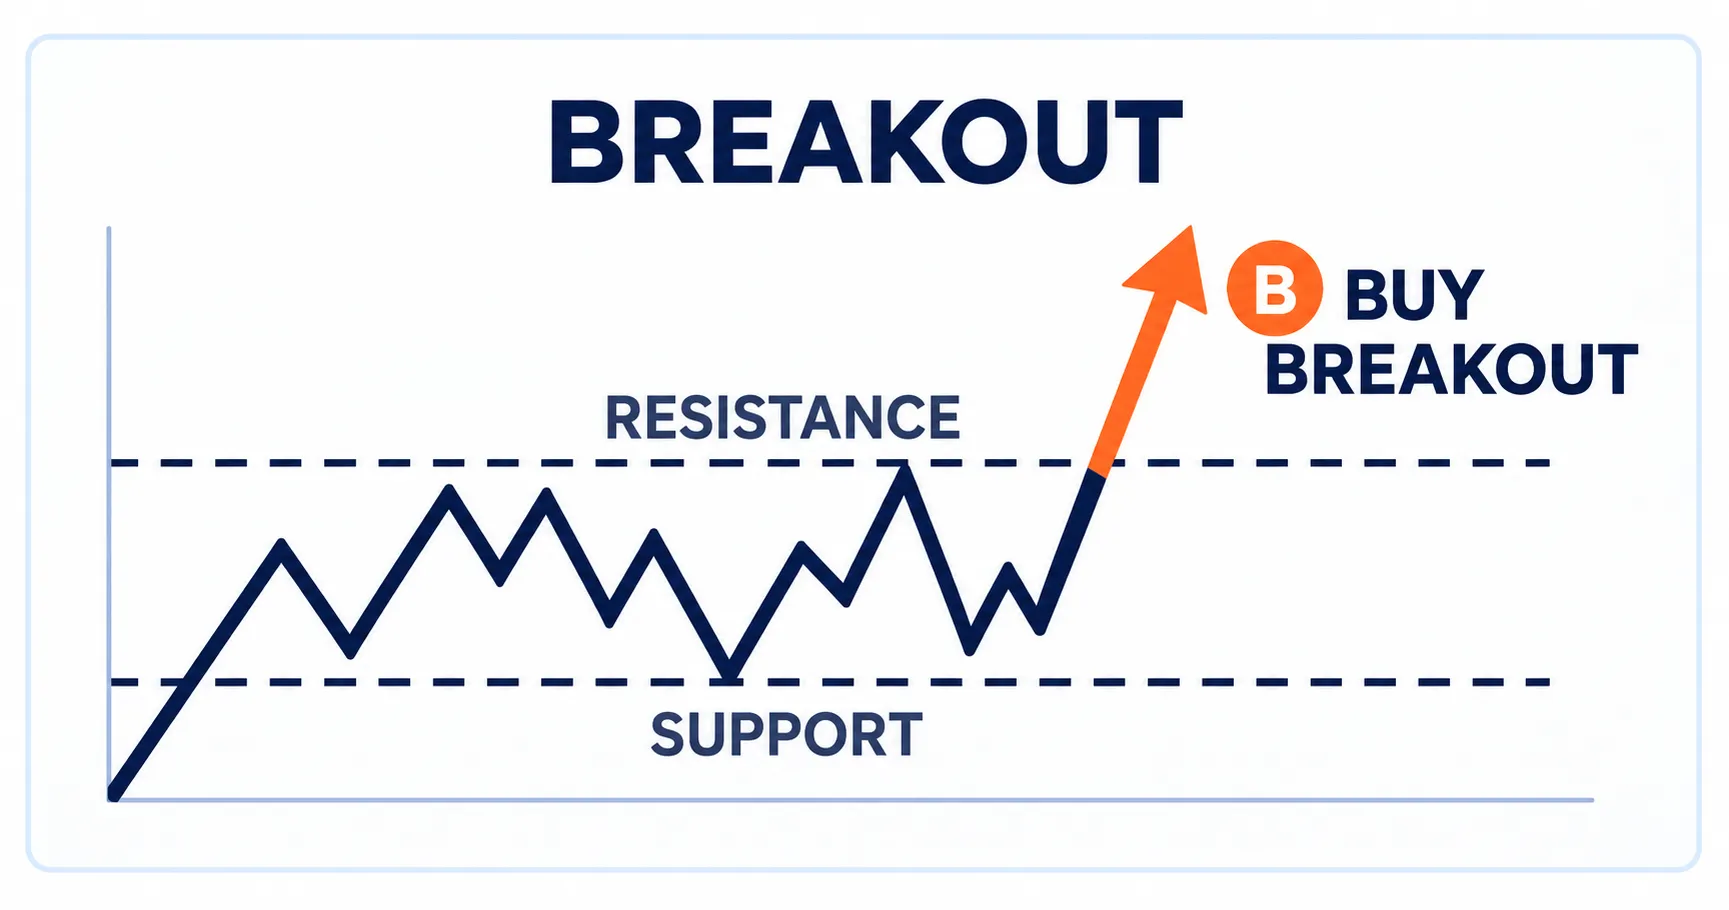
Breakout traders watch for prices to move above resistance or below support. These are areas where buying or selling has previously kept the market within a range.
A rise in trading volume can help assess whether the move has broader participation. Traders closing positions after the break can also add to the price movement.
The risk is a false breakout: The price crosses a level, attracts new positions and then returns to its previous range. With leverage, that reversal can quickly produce losses and pressure the trader’s margin balance.
4. Responding to accelerating momentum
Momentum trading focuses on the strength and speed of a move. A sharp price change accompanied by rising volume may attract traders who expect the movement to continue.
Technical oscillators, which measure aspects of price strength or speed, can help assess momentum. Compared with a longer trend-following position, these trades often focus on a shorter burst of activity.
Fast moves can produce substantial gains or losses in leveraged positions. Momentum can also fade abruptly, leaving traders exposed to a reversal before they have time to react.
Futures trading strategies built around a holding period
Some strategy labels describe how long a position stays open. Swing trading, day trading and scalping can all use directional signals, but they create different demands on the trader’s time, execution and account balance.
5. Holding through a wider price swing
Swing traders aim to capture moves lasting several days or weeks. In commodity markets, changing supply and demand can create price swings that develop over a longer period than a single session.
Holding a position gives the trade time to develop, but it also creates overnight exposure. News released while the market is closed can cause the next available price to jump past a planned exit level.
This is known as gap risk. Swing traders also need enough account equity to meet the margin requirements that apply while their positions remain open.
6. Opening and closing within the trading day
Day traders close their positions before their chosen trading day ends. That removes overnight exposure from those positions, while keeping the focus on intraday price movements.
Tick values are particularly relevant because they show how each small movement affects the position in dollar terms. Frequent trades also make transaction costs a significant part of the calculation.
Day trading requires close monitoring and timely decisions. Traders still need to understand the contract’s settlement process, through which gains and losses are reflected in account balances.
7. Targeting small moves through scalping
Scalpers trade very short-term price changes, sometimes holding a position for only seconds. Each trade may target just a few ticks, making execution speed and trading costs especially important.
A tight bid-ask spread, the gap between available buying and selling prices, helps keep entry and exit costs lower. Highly liquid contracts are often used because they can make it easier to trade with less slippage, meaning less difference between the expected and executed price.
Small gains leave little room for a large loss. Stop-loss orders can support a scalper’s exit plan, but fast markets can still produce an execution price worse than expected.
Futures trading strategies that question the current price move
Not every trader expects a move to continue. Mean reversion and fading look for signs that a price has gone too far, while spread trading focuses on how related contracts move relative to each other.
8. Looking for a return toward the average
Mean reversion starts with the idea that a price stretched far from its usual range may move back toward its average. Traders often use this approach in sideways markets, where prices repeatedly move between established levels.
Bollinger Bands can help show how far a price has moved from its recent average relative to volatility. A move outside the bands may attract attention, but it does not establish that a reversal is coming.
A strong trend can keep pushing prices further away, and the average itself can shift. Entering too early can leave a leveraged position facing growing losses or a margin call.
9. Fading a move that appears exhausted
Fading means taking the opposite side of a move that appears to be running out of strength. A trader might look for a sharp rally to stall or a steep decline to lose momentum.
Falling volume near a key price level can be one sign of exhaustion. This approach often targets a market beginning to settle into a range after a strong move.
The challenge is that an apparent extreme may be the beginning of a larger trend. Fading requires careful execution because trading against that move can become costly quickly.
10. Trading the difference between related contracts
Spread traders buy one contract and sell a related contract, focusing on changes in the difference between their prices. Their exposure depends on how the two sides move relative to one another, rather than simply whether the broader market rises or falls.
Common futures spreads include:
- Calendar spreads: Positions in different expiration months of the same underlying asset.
- Inter-commodity spreads: Positions in related markets, such as a processing relationship between a raw commodity and its products.
- Multi-leg spreads: Structures such as butterflies or condors, using three or four components to trade relationships across the futures curve.
These approaches require an understanding of how the contracts interact. A view on the overall direction of the market alone does not explain how the spread will behave.
Which chart tools help traders assess a setup?
Technical indicators help organize price and volume information. Different tools answer different questions, so traders often combine them to assess direction, momentum and potential entry or exit levels.
Tools for identifying direction and momentum
Moving averages smooth prices over a chosen period, making the broader direction easier to follow. Traders also compare the current price with an average to assess how far the market has moved from it.
Moving average convergence divergence (MACD) compares moving averages to help identify changes in trend and momentum. Crossovers can suggest that the direction or strength of a move is changing.
The relative strength index (RSI) measures price momentum on a scale from zero to 100. Readings above 70 are commonly described as overbought, while readings below 30 are described as oversold. These labels do not guarantee that a price will reverse.
Tools for assessing levels and price ranges
Support marks an area where buying has previously helped stop a decline. Resistance marks an area where selling has limited a rise. Traders use both to assess breakouts and plan potential entry or exit points.
Fibonacci retracement tools mark levels within a previous price move, including 38.2%, 50% and 61.8%. Pullback traders watch these areas for possible support or resistance.
Bollinger Bands place two volatility-based bands around a moving average. The bands widen or narrow as volatility changes, helping traders assess whether a price is unusually far from its recent average.
Tools that incorporate trading volume
Volume-weighted average price (VWAP) calculates an average price weighted by the amount traded at each level. Intraday traders use it as a benchmark for comparing the current price with trading activity during the session.
VWAP also has a role in settlement calculations for certain contracts. CME describes a final 30-second VWAP calculation for the front-month daily settlement of many equity index futures, although the applicable method depends on the product.
How do traders manage the risks behind these strategies?
A strategy describes the trade a participant wants to make. Risk management addresses what happens if that trade fails, costs more than expected or becomes difficult to close.
Position size and planned exits
Position sizing determines how much exposure a trader takes. Some traders use a planned risk allowance of 1% to 2% of account capital per trade, but that is a convention rather than a guarantee that losses will stay within those limits.
Stop-loss and limit orders establish an intended exit if the market moves against a position. They can help reduce emotional decisions, including opening another trade simply to recover a loss. Gaps, slippage and execution conditions can still cause losses to exceed the planned amount.
Margin requirements and settlement
Maintenance margin is the minimum account equity required to support an open position. If the balance falls below the applicable requirement, the trader may need to add funds or reduce exposure. Positions may also be liquidated under the broker’s or venue’s rules.
Mark-to-market settlement regularly credits gains and debits losses. Futures are generally settled daily, and clearing arrangements may include additional intraday cycles. Traders need to understand the schedule that applies to their contracts rather than assume every venue follows the same process.
Trading halts and position limits
Exchanges can pause or limit trading during extreme price moves. Circuit-breaker thresholds and the length of any halt depend on the market, contract and trading session.
Position limits restrict the number of contracts a participant can hold. Regulators and exchanges use these controls to address excessive speculation and market manipulation. They operate alongside individual account controls, rather than replacing a trader’s own risk management.
How to trade perpetual futures with OG.com
- Create an account: Sign up and complete identity verification. Access to perpetual futures is subject to eligibility.
- Explore crypto perps: Choose an available cryptocurrency contract and review its margin requirements, fees and funding arrangements.
- Review and trade: Fund your account, choose your position size and decide whether to go long or short. A limit order lets you set the highest price you’ll pay or the lowest price you’ll accept, but execution isn’t guaranteed.
- Monitor your position: Track price movements, funding payments and your margin balance. Leverage amplifies gains and losses, and insufficient margin can lead to liquidation.
FAQs about futures trading strategies
Are some futures strategies easier to understand than others?
Trend following and breakout trading are often easier to visualize because they focus on direction and identifiable price levels. That makes the concepts relatively accessible, but it does not make the trades low-risk or establish one approach as the best for beginners.
Does every futures strategy involve holding overnight?
No. Day traders aim to finish their trading day without an open position, while scalpers may close trades within seconds. Swing traders typically hold for days or weeks and accept the overnight exposure that comes with that approach.
Why do breakout traders watch previous highs and lows?
Previous turning points can identify areas where buying or selling has constrained the price. A move beyond those areas may signal a change in market behavior, although traders still face the possibility that the breakout will fail.
Can moving averages help with exits as well as entries?
Yes. Alongside identifying the broader direction, moving averages can provide a changing reference level for exit decisions or trailing stop-loss placement. They reflect past prices and cannot establish what the market will do next.
Is a pullback the same as a reversal?
A pullback is a temporary move against the prevailing trend; a reversal changes that trend. The difficulty is telling them apart while the move is happening, which is why a pullback trade still needs an exit plan.
What changes when a strategy uses perpetual futures?
Perpetual futures have no scheduled expiry, so traders do not replace contracts simply because an expiration date is approaching. Periodic funding payments help align prices with the spot market and can affect the cost of holding a position.
Are perpetual contracts available on stock indices?
Some venues offer perpetual contracts linked to US stock indices. Access to a particular index depends on the platform’s product range and the trader’s jurisdiction and eligibility.
Why can a small futures price move create a large account loss?
The gain or loss is based on the position’s market exposure, which can be much larger than the margin posted. A modest unfavorable move can therefore use up a substantial share of the money supporting the trade.
How does scalping differ from capturing a multi-day swing?
Scalping relies on frequent, small price changes and places heavy demands on execution and cost control. Swing trading gives a larger move more time to develop, while exposing the position to overnight news, price gaps and ongoing margin requirements.
Important Information: OG.com provides technology in order to onboard and trade products on OG.com’s CFTC-regulated exchange and clearinghouse: North American Derivatives Exchange, Inc., which does business under the brands OG.com Markets and OG.com Prediction Markets, as well as, through OG.com’s CFTC-registered Futures Commission Merchant (Foris DAX FCM LLC or OG.com Broker).
OG.com Markets offers both prediction market event contracts (Prediction Markets Contracts), as well as margined derivatives, including single stock futures and perpetuals (Futures) (Prediction Markets Contracts and Futures are collectively referred to as OG.com Markets Products). Prediction Markets Contract can be accessed directly on OG.com Markets or through a CFTC-registered FCM, including OG.com Broker, or an Introducing Broker (IB). Futures must be accessed through a CFTC-registered FCM, including OG Broker or an IB.
Trading OG.com Markets Products involves risk and may not be appropriate for all. By trading you risk losing your cost to enter any transaction, including fees. You should carefully consider whether trading OG.com Markets Products is appropriate for you in light of your investment experience and financial resources. Any trading decisions you make are solely your responsibility and at your own risk.