Party to control the US House of Representatives in 2026: predictions and forecast tracker
Prediction markets heavily favor the Democrats, in line with the expert forecast, yet margins vary.
Politics
By Barbara Pazur
Republicans have little room for losses in the House this November. Cook Political Report recently shifted 18 House race ratings toward Democrats, adding to the uncertainty over who'll control the chamber after the midterms.
Democrats need 218 seats to take control of the House of Representatives. Recent forecasts project Democratic gains. RealClearPolling's generic congressional ballot average points in the same direction, showing Democrats ahead by 7.9 points.
This article is for informational purposes only and should not be construed as financial or investment advice. Trading involves risk.
What is the 2026 House election forecast?
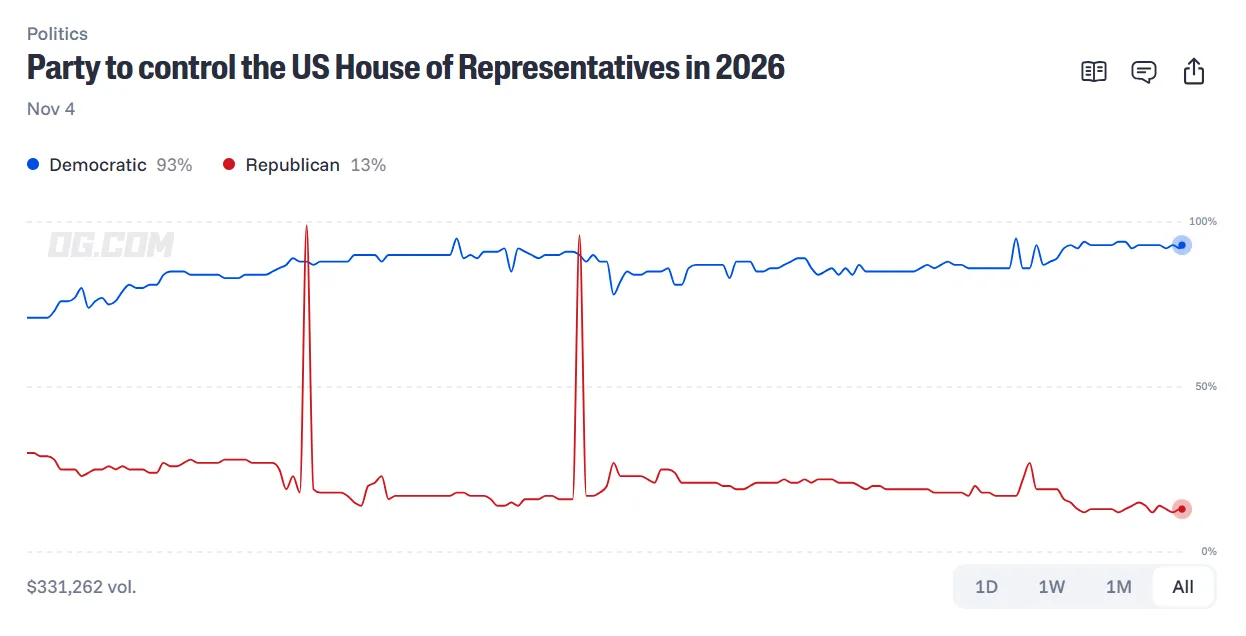
OG.com’s House-control prediction market currently shows 93% for the Democratic outcome and 13% for the Republican outcome, heavily favoring the Democrats as of October 15.
Market data as of October 22. For the latest probabilities, visit
On October 9, Cook Political Report moved 18 House race ratings toward Democrats and estimated the party could gain nine to 19 seats. That would give Democrats between 224 and 234 seats, above the 218 needed for a majority.
CBS News' Battleground Tracker also projected a Democratic majority of 229 seats to Republicans' 206 if the election were held at the time of its October 4 survey.
We can see similar findings in national polling. Pew Research Center's October 8 report found 44% of registered voters supporting Democratic House candidates, compared with 36% for Republicans. Economist/YouGov also reported an eight-point Democratic lead among registered voters in its October 2 to 5 survey.
These surveys measure voter preferences rather than projected seat totals. The final House majority depends on how those preferences translate into results across individual congressional districts.
Expert forecasts versus prediction markets
Election forecasters use different approaches to estimate who could control the House after the midterms. Some project how many seats each party could win, while others calculate the probability of either party securing a majority.
The table below compares 2026 midterm election predictions from expert forecasters with current prices in the OG.com House-control prediction market.
Cook Political Report
Democrats projected to gain nine to 19 seats, reaching 224 to 234
Decision Desk HQ
76% probability of Democratic control, 24% Republican
Sabato's Crystal Ball
Around 230 Democratic seats, with 20 districts rated Toss Up
Silver Bulletin
About 93% probability of Democratic control
OG.com prediction market
Democratic outcome at 93%, Republican at 14% market-implied probabilities.
Based on publicly available information as of October 12, 2026. Sources: Cook Political Report/Decision Desk HQ/Sabato's Crystal Ball/Silver Bulletin.
Cook Political Report and Sabato's Crystal Ball assess individual districts to estimate the final seat count. Decision Desk HQ and Silver Bulletin use statistical models to calculate the probability of each party controlling the House.
Prediction markets, like OG.com, reflect the prices traders are paying for contracts tied to election outcomes. On OG.com, contracts for Democratic and Republican control are priced separately, which is why their displayed percentages don't necessarily add up to 100%.
All these estimates can change as new polling and election developments emerge.
The 218-seat math: how many seats need to flip
All 435 voting House seats are contested in the midterms, and a party needs at least 218 for a majority.
In the 2024 House elections, Republicans won 220 seats and Democrats won 215. Based on those results, Democrats need a net gain of three seats to secure the 218-seat majority, assuming all seats go to the two major parties.
Democrats have several Republican-held districts in play, but they're also defending competitive seats of their own. Republican victories in Democratic-held districts would offset some potential Democratic gains.
Republicans could protect their majority by limiting those gains, while Democrats would need to turn their polling advantage into wins across enough individual districts.
How redistricting reshaped the 2026 House map
Congressional district boundaries determine which voters elect each House representative. For the 2026 elections, nine states have new maps: Alabama, California, Florida, Louisiana, North Carolina, Ohio, Tennessee, Texas and Utah.
Texas led the redistricting push in 2025, with Republicans aiming to gain five additional House seats. California voters responded by approving a map intended to create five more Democratic opportunities. Cook Political Report also identifies potential Republican gains in Florida, North Carolina and Ohio, while Utah's court-ordered map could benefit Democrats.
Missouri also approved a Republican-backed map, but it won't be used in November. Following a September 23 Supreme Court decision, the state must hold its 2026 House elections under the same boundaries used in 2024.
Key toss-up and battleground districts to watch
Of the 21 House races Cook Political Report rates Toss Up, 15 are Republican-held and six are Democratic-held. Several other Republican-held districts, including Iowa's 1st and Pennsylvania's 7th, are rated Lean Democrat.
District
Incumbent
Cook rating
Iowa 1st
Mariannette Miller-Meeks (R)
Lean Democrat
Pennsylvania 7th
Ryan Mackenzie (R)
Lean Democrat
North Carolina 1st
Don Davis (D)
Toss Up
New York 17th
Mike Lawler (R)
Toss Up
Colorado 8th
Gabe Evans (R)
Toss Up
Ohio 7th
Max Miller (R)
Toss Up
Texas 15th
Monica De La Cruz (R)
Toss Up
Based on publicly available information as of October 12, 2026. Source: Cook Political Report. Other forecasters may assess these districts differently.
Republicans are also targeting Democratic-held districts such as North Carolina's 1st, where Cook rates Don Davis' race Toss Up. A Republican victory there would offset one Democratic gain elsewhere, adding to the number of Republican-held seats Democrats would need to flip to secure a majority.
Scenarios that could change the House outlook
President Trump's approval stood at 32% among U.S. adults in a Reuters/Ipsos survey conducted September 30 to October 5. Only 20% approved of his handling of inflation and rising prices.
An improvement in those ratings before November 3 could change the political environment for Republican House candidates.
In an October Economist/YouGov survey, 37% of Americans identified inflation and prices as the country's most important issue. The next Consumer Price Index (CPI) report, scheduled for October 14, could affect how voters assess the economy in the final weeks before Election Day.
Another Economist/YouGov poll found a 12-point Democratic lead among registered voters who had already voted or said they definitely would, compared with an eight-point lead among all registered voters. Actual turnout could produce a different balance, particularly in districts decided by small margins.
How to trade political prediction markets on OG.com
With OG.com, you can trade event contracts on real-world outcomes across different market categories.
Create an account: Open an account and complete sign-up, including identity verification. You can use our web or mobile platforms.
Recent forecasts from Cook Political Report and Silver Bulletin show stronger Democratic prospects for House control.
How many seats do Democrats need to flip to win the House?
Democrats need at least 218 seats, equivalent to a net gain of three from their 215-seat result in 2024.
What are the current forecaster probabilities for each party?
Decision Desk HQ gives Democrats a 76% chance and Republicans 24%, while Silver Bulletin's October 11 model estimates about 93% for Democratic control.
How does redistricting affect the 2026 House map?
New district boundaries have changed the partisan makeup of several House seats, creating different opportunities for both parties.
Which House races are rated toss-up for 2026?
Competitive districts include New York's 17th, Colorado's 8th, Ohio's 7th and North Carolina's 1st, although ratings vary by forecaster.
Does the president's party usually lose seats in midterm elections?
Historical results show the president's party typically loses House seats in midterms, although the size of those losses varies.
How does presidential approval correlate with midterm seat losses?
Gallup found that presidents below 50% approval experienced average House losses of 37 seats, compared with 14 for presidents above that threshold.
What are the generic congressional ballot polls showing for 2026?
Recent national polls show varying Democratic leads. RealClearPolling's average of surveys conducted through October puts Democrats at 49.8% and Republicans at 41.9%, a 7.9-point lead.
How do prediction-market probabilities compare with expert forecasts?
Recent prediction-market prices imply roughly a 91% to 93% chance of Democratic House control, including 93% on OG.com. Decision Desk HQ's forecast puts the probability at 76%, compared with about 93% from Silver Bulletin.
What events could still shift the 2026 House outlook before Election Day?
New economic data or late polling changes could affect expectations, while unexpected turnout patterns could alter results in competitive districts.
Important Information: Prediction is an event contract that is a derivatives product offered by North American Derivatives Exchange, Inc. (NADEX), a CFTC-regulated exchange, which does business under the brand OG.com Prediction Markets (OG) Crypto.com | Derivatives North America and uses a CFTC-regulated exchange that uses OG.com technology.
Trading on OG.com involves risk and may not be appropriate for all. By trading you risk losing your cost to enter any transaction, including fees. You should carefully consider whether trading on OG.com is appropriate for you in light of your investment experience and financial resources. Any trading decisions you make are solely your responsibility and at your own risk.