How to trade US recession 2026 odds in prediction markets
Recession markets don’t wait for an official announcement. Prices can shift months earlier as traders react to inflation, hiring, Fed policy, credit stress and growth data.
Financials
By Barbara Pazur
This guide explains how US recession 2026 odds work, what can move the price and what to check before trading a long-dated event contract.
This article is for informational purposes only and should not be construed as financial or investment advice. Past performance does not guarantee future results.
What ‘US recession in 2026’ odds actually mean
US recession 2026 odds show the market-implied chance that a defined recession event happens within the contract’s stated window. In a prediction market, traders buy and sell event contracts tied to that outcome.
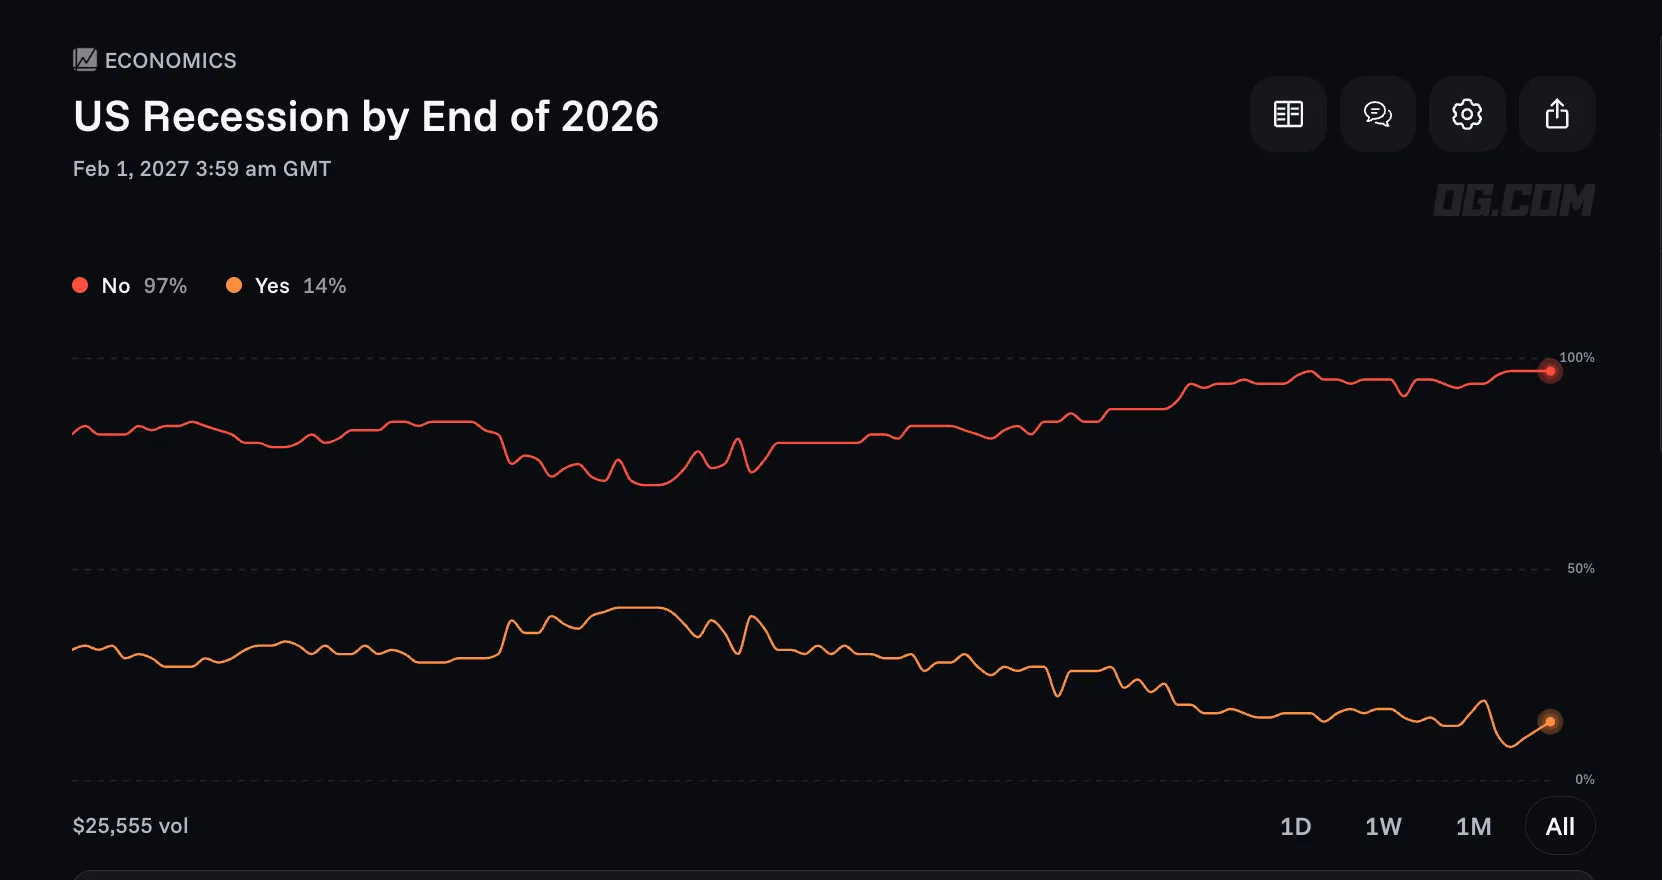
For example, on OG.com, the "US Recession by End of 2026" – "No" contract is trading at 97¢. That can be read as roughly a 97% market-implied chance that the US will not enter a recession by the end of 2026, before fees and market rules. If the price falls, it means traders are pricing a higher probability of a recession.
The price doesn’t show certainty. It changes as traders react to new information, including economic data, Fed commentary, market positioning and broader risk sentiment.
Market data as of 11 August 2026. For the latest prediction prices, check the
How recession contracts are typically defined and settled
The word ‘recession’ can mean different things depending on the rulebook. One contract may use official data from the National Bureau of Economic Research (NBER). Another contract may use gross domestic product (GDP), or a definition tied to a different data release.
Definition
Who sets it
What it measures
Why it can differ from headlines
NBER recession dating
NBER
Broad economic activity
The official call usually comes after the slowdown has already started
Two quarters of negative GDP
BEA data
Real GDP growth
GDP can shrink while other parts of the economy still look steady
For example, on OG.com, the "US Recession by End of 2026" contract settles "Yes" if the US Bureau of Economic Analysis (BEA) reports at least two consecutive quarters in 2026 where seasonally adjusted annualized real GDP growth is negative.
That definition decides settlement. A news headline can say recession risk is rising, but the contract only settles ‘Yes’ if the listed criteria are met. The market price can move long before that final decision because traders are reacting to the data path as it develops.
Before trading, scan the rules for:
What counts as a recession and settles the outcome.
The deadline, such as ‘by the end of 2026.’
How revised or delayed data is handled.
What moves US recession 2026 odds
US recession markets move when new data changes the path between slowdown and recession. Right now, growth is still positive, the labor market has not cracked, inflation remains stubborn, and the Fed is expected to keep policy tight for longer. A July Reuters poll had economists expecting roughly 2% U.S. growth, unemployment near 4.2%, and no Fed rate cuts in 2026.
The Conference Board’s June 2026 Leading Economic Index fell 0.2%, but the decline over the first half of the year was much smaller than in late 2025, suggesting the economy may be slowing without yet tipping into recession.
The main drivers usually include:
Labor-market cracks: Recession markets tend to react quickly to weaker payrolls, higher unemployment, rising continuing claims, or layoffs spreading beyond one sector. A stable labor market can keep recession odds contained, while a sharp move higher in unemployment can change the market fast.
Inflation and Fed pressure: Sticky inflation can keep rates higher for longer. That matters for recession markets because tighter policy can weigh on hiring, credit, housing, and business investment.
Consumer spending: Consumer spending drives a large share of U.S. growth. Retail sales, credit-card delinquencies, savings trends, and real wage growth can all shift how traders read household strength.
GDP and growth revisions: A weak GDP print, lower revisions, or soft business investment can push markets toward a slowdown story. Stronger growth can pull recession odds lower, especially if it comes with steady hiring.
Credit stress: Wider credit spreads, rising defaults, tighter bank lending, or pressure in commercial real estate can raise recession risk before it shows up in headline GDP.
Oil, tariffs, and external shocks: Energy spikes, trade costs, geopolitical events, and supply disruptions can hit inflation and spending at the same time. That mix is especially important when the Fed already has limited room to ease.
Analyst forecasts give traders another reference point, but they don’t settle the market. J.P. Morgan’s 2026 outlook put the probability of a U.S. and global recession at 35%, while the Conference Board’s July forecast still projected 1.9% U.S. GDP growth for 2026.
That split is useful for a recession market. If the incoming data starts matching the downside forecasts, recession odds can rise. If growth, hiring, and spending keep holding up, the market may keep pricing recession as a risk rather than the base case.
Recession odds vs. traditional indicators
Prediction market prices don't move in isolation. Traders often use traditional economic indicators to assess whether recession odds look too high or too low and to gauge how new data could affect the market.
These indicators can help explain why prices move, but they don't determine the outcome of a contract unless they're part of its settlement rules.
Signal
What it captures
Update frequency
How it can show up in odds
Yield curve
Rate expectations and growth concerns
Daily
Can drift over time, then reprice quickly when the story changes
Unemployment rate
Labor-market slack
Monthly
Can move odds sharply when the print surprises
Inflation
Pressure on prices and Fed policy
Monthly
Can quickly change how traders price the Fed path
Market price
Market-implied recession probability
Continuous
Moves as traders react to data, headlines and positioning
How traders might approach a recession market
Say you’re watching a US recession 2026 contract. A trader could break the setup into checkpoints:
Translate the price: Treat 97¢ as roughly a 97% market-implied chance.
Read the contract: Check the recession definition, deadline, settlement source and data-revision rules.
Map the next catalysts: Look at all relevant data points upcoming in the calendar. For example – CPI, the monthly jobs report and the next Fed meeting.
Plan for volatility: Those catalysts can move the price sharply, even if they don’t decide the final outcome.
Review each checkpoint: After every catalyst, check whether the market moved because the data changed the outlook or because the result differed from expectations. Reread the rules if the market description changes.
How to trade US recession predictions on OG.com
With OG.com, you can trade event contracts on real-world outcomes across different market categories.
Create an account: Open an account and complete sign-up, including identity verification. You can use our web or mobile platforms.
Browse markets: Explore markets across economics, including the US recession events.
Review and trade: Compare the market price with your own view. Check the rules, fees, and settlement details before opening a position.
Monitor your position: After trading, your contract appears in your open positions, where you can track price movement as new information comes in.
No one knows the exact chance of a U.S. recession in 2026. At the time of writing, OG.com trades price the chance of a recession by the end of 2026 at 14%. Other indicators point to a mixed picture. Goldman Sachs Research projected 2.5% U.S. GDP growth in 2026, above the 2.1% consensus estimate, and put the probability of a recession in the next 12 months at 20%. J.P. Morgan Global Research put the probability of a U.S. and global recession in 2026 at 35%.
What are the odds of a recession in 2026?
In prediction markets, recession odds come from the contract price. If an OG.com recession market is priced at 14%, the market is pricing about a 14% chance for that specific contract. That number applies to the contract’s deadline, rule text, and settlement source. It can move when traders react to inflation data, jobs reports, GDP revisions, Fed policy, credit stress, or major shocks.
What is the probability of a recession In 2026?
A prediction market price can be read as market-implied probability. A contract priced at 14 cents points to about a 14% market-implied chance before fees and spread. Economists may reach a different number because they use different models. The Fed’s June 2026 projections still showed positive growth, with median real GDP growth of 2.2% and unemployment at 4.3% for 2026. A July Reuters poll also had economists expecting roughly 2% growth and unemployment near 4.2%.
What data releases usually move recession odds the most?
Inflation reports, jobs data, GDP revisions, Fed meetings, credit conditions and major shocks can move recession odds when they change the market’s view of growth risk.
Important Information: Prediction is an event contract that is a derivatives product offered by North American Derivatives Exchange, Inc. (NADEX), a CFTC-regulated exchange, which does business under the brand OG.com Prediction Markets (OG) Crypto.com | Derivatives North America and uses a CFTC-regulated exchange that uses OG.com technology.
Trading on OG.com involves risk and may not be appropriate for all. By trading you risk losing your cost to enter any transaction, including fees. You should carefully consider whether trading on OG.com is appropriate for you in light of your investment experience and financial resources. Any trading decisions you make are solely your responsibility and at your own risk.